During the new home router infra exercise, I also chose to set up as reasonable as possible (lightweight) observability stack for my use. The holy trinity is defined to be metrics, logs, and traces, but as I do not really do much that requires tracing I focused initially on the first two. This exercise occurred mostly in February.
Software choices
Visualization
I chose to go with Grafana. I am very familiar with it, and there seems to be an ecosystem of third-party tools which replicate some of what Aiven had (e.g. dashboard backup/restore tooling, dashboard rewriter I wrote fingon/gg-grafana: Grafana dashboard sanitizer as I could not find something similar in the open world, and so on).
Then, I needed to pick up metrics and logging solutions that were compatible with it.
Metrics
I have been involved with M3: Open Source Metrics Engine at some point in the past. The open-source project part of it has seemingly stalled awhile ago, as last release was over 2 years ago (April 2022), and even before that they were not very keen to accept even relatively straightforward or simple contributions (e.g. [coordinator] influxdb write endpoint: Return telegraf-compatible errors by fingon · Pull Request #2331 · m3db/m3 from 2020, we maintained a fix in our branch for years).
However, as my home infrastructure consists of only few hosts (and at most dozens of containers), the metrics needs are a lot more modest than what M3 provides. So I chose to go with VictoriaMetrics instead. I had been aware of it for years, and it seemed to be quite nice for small sized deployments (I do not like their clustering story very much, but that is a subject for another post).
Now, bit over 3 months in, the choice has been excellent. 3 months’ retention period of my home infra is currently 2.2GB, all queries get responses rapidly, and the metrics ingestion does not seem to be using that much resources either.
Logs
On logs side, I have been OpenSearch believer (and ElasticSearch before that, but I am not fan of what they did with the licensing). I have been intrigued by the object storage driven (as opposed to object storage supporting) products such as grafana/loki: Like Prometheus, but for logs., and VictoriaLogs, though, and I saw this as an opportunity to try them out.
At the time I evaluated them, it seemed the Grafana datasource for VL was painful to configure, Grafana supported only Loki query language out of the box, and VL for Loki query language had stalled ( see faceair/VictoriaLogs: Loki On VictoriaMetrics and the linked official VM issue discussion ).
I was still reluctant to choose just only one, so I chose to set up both, because the log amounts for my home infra was predicted to be relatively small. This panned out, as the actual storage for 3 months’ usage is:
- 174MB for Loki
- 209MB for VictoriaLogs
Currently I am wondering if I should just phase out VL, as I am mostly using Loki, but as it does not consume significant amount of resources I have been reluctant to do that - backfilling data is always clunky, and if I have the data already there, I can switch to using VL as primary data source whenever I want to. Query language of VL seems also bit more human-friendly than Loki, although it might be just my lack of experience showing.
Pipeline tooling
Having chosen the databases and visualization software, the next question was how to fill the databases with logs and metrics data. I needed to extract both logs and metrics from
- actual hosts (e.g. laptop, NAS, home router to name 3 but there is bit more than that)
- containers (mainly on home router; lxc, rootless podman, rootful podman)
and I wanted to find something unified. Again, at Aiven, we had switched to using Vector for some of the stuff, and I wanted to try using it for this exercise too.
I could probably write a blog post just about Vector too, but I am not really one for writing for writings sake. To briefly recap, neat features it has include:
- visualization of the pipeline (see below)
- unit tests (no more guessing if I got regexps right when writing configuration)
- decent performance (Rust, reasonable parallelism)
- no dependencies
Main home infra observability pipeline (on the home router) as of 202405:
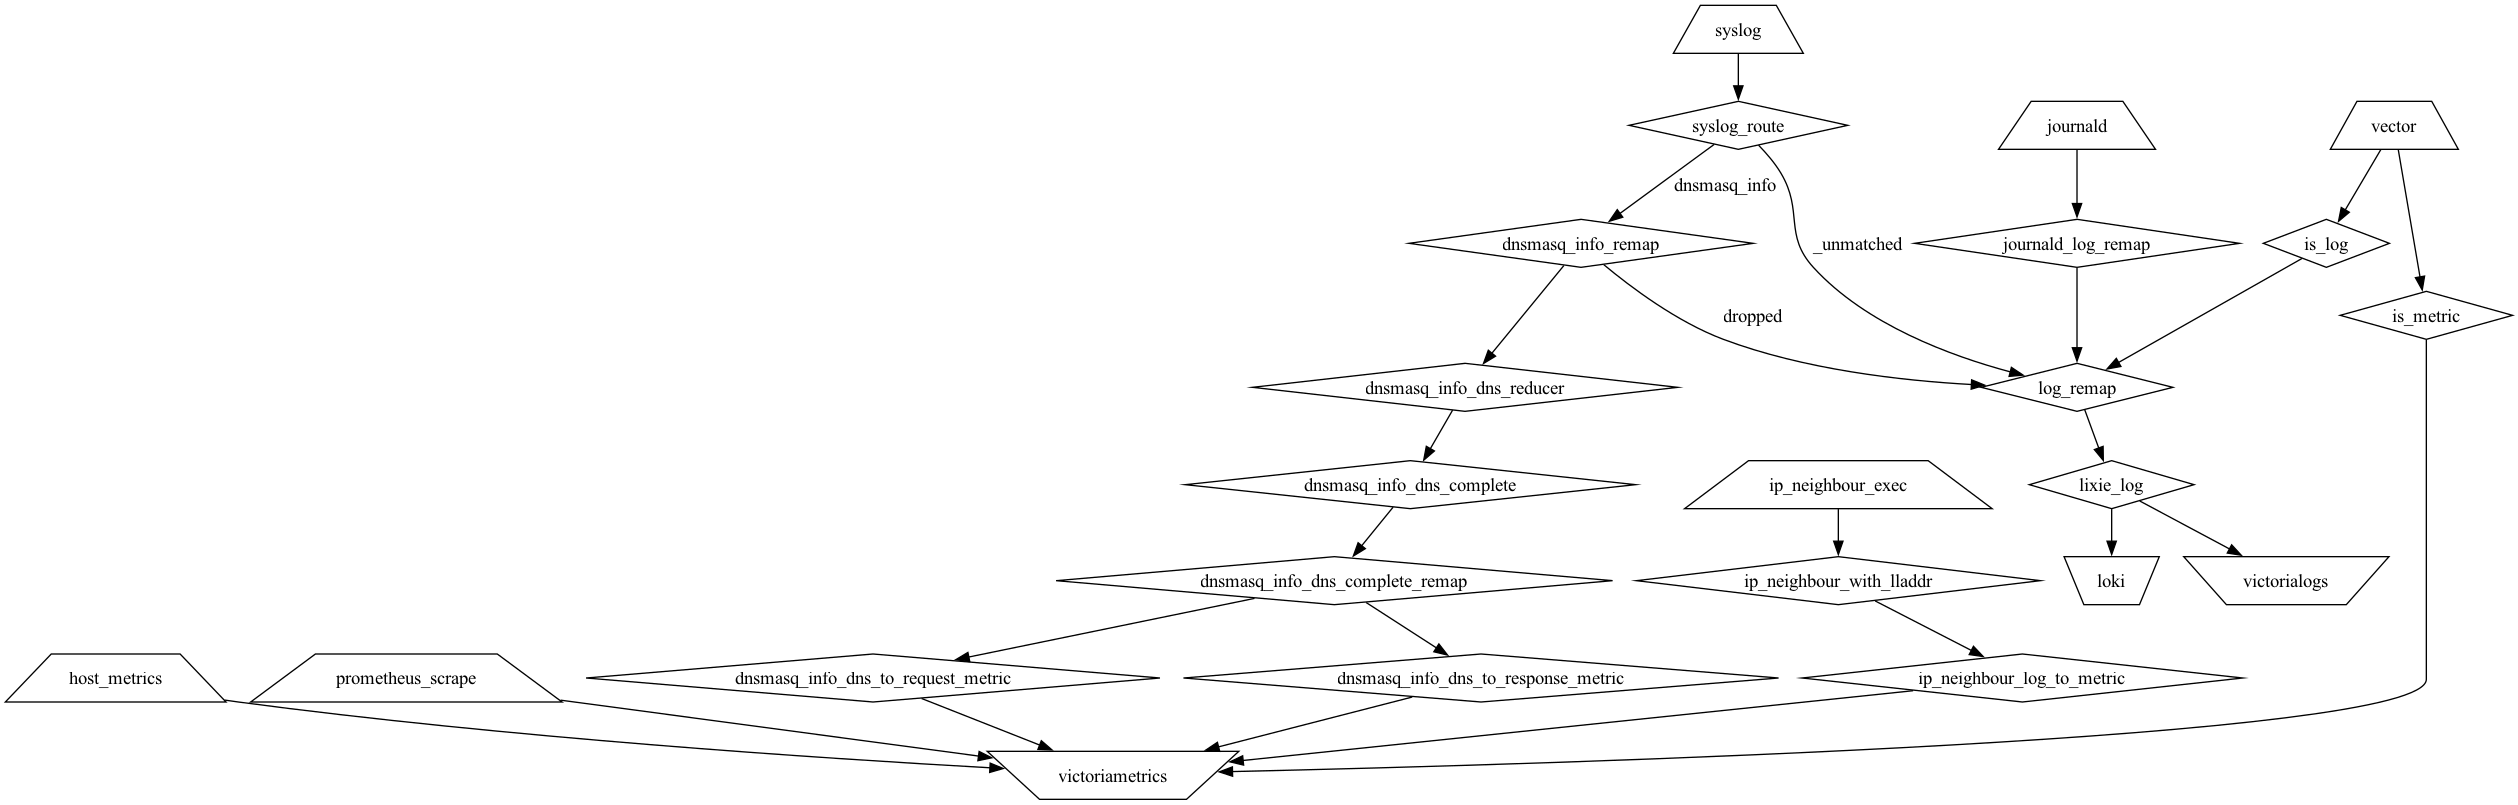
Unlike most of the other things in my home, this is not containerized; vector is installed on each host, as it needs direct access to e.g. journald. I am doing some ‘funny’ stuff in the pipeline as shown in the diagram.
There’s couple of data sources:
- (logs) local journald
- podman containers’ logs are piped in by starting podman containers with
—log-driver journald - some lxc containers produce logging out of the box
- podman containers’ logs are piped in by starting podman containers with
- (logs) OpenWrt lxc container provides syslog entries
- (logs+metrics) remote vectors
- (metrics) host metrics
- (metrics) prometheus scraping
- these are mostly from containers, and I do not really care about the ‘system resource’ metrics (e.g. CPU, memory, disk), but they are mostly application specific ones
And there are some interesting transformations of note:
- converting log entries from (lxc) OpenWrt dnsmasq logging to actual metrics about DNS access (these are not forwarded at all to logs store, due to preferring deduplicating the data and DNS being quite spammy - my home resolver deals with one query per second or so, all the time..)
- converting shell script output about active IPv4 and IPv6 neighbours to metrics (for analysis use)
- large number of fingon/lixie: Small infra analysis tool. This is mostly personal tool but I am making it open source from the start. rules for logs (currently 400+)
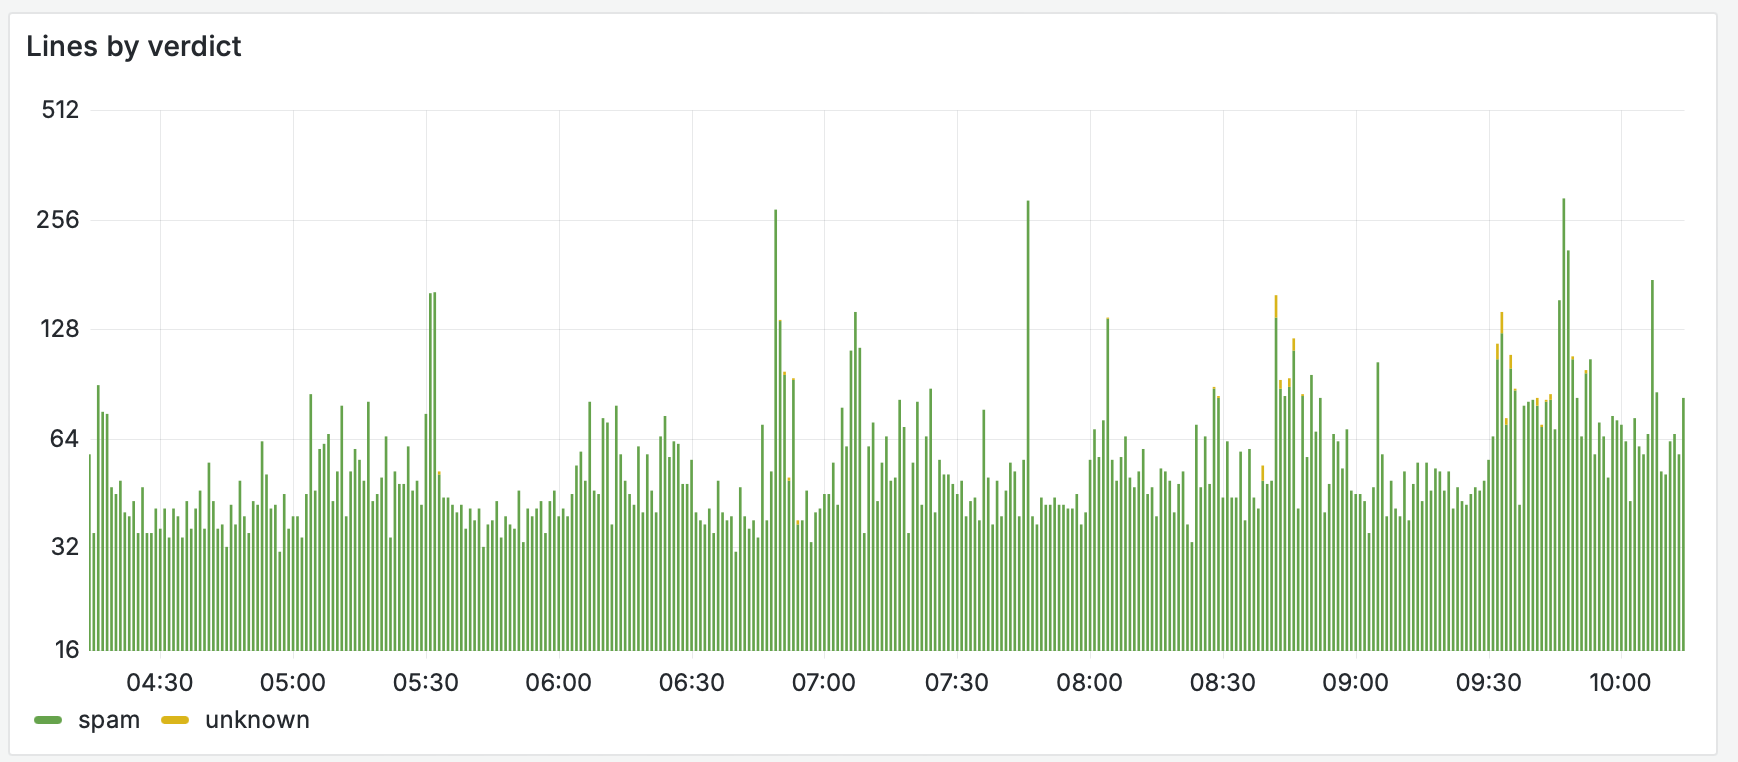
Lixie
Lixie I will probably write about more in the future (the technical aspects of it, as it is a new hobby project of mine), but it is a way of classifying log lines (using either exact or regexp matches of fields) as either ham, or spam; by default they are unknown. For example, during the last 6 hours, there has been nothing ham (that I should really care about), but some unknown entries in my home (note that scale is logarithmic so the green part is in practise even larger):
 as you can see, there is quite a bit of logging going on. However, ‘what happened in 6 hours and is interesting’ view in Grafana looks quite brief:
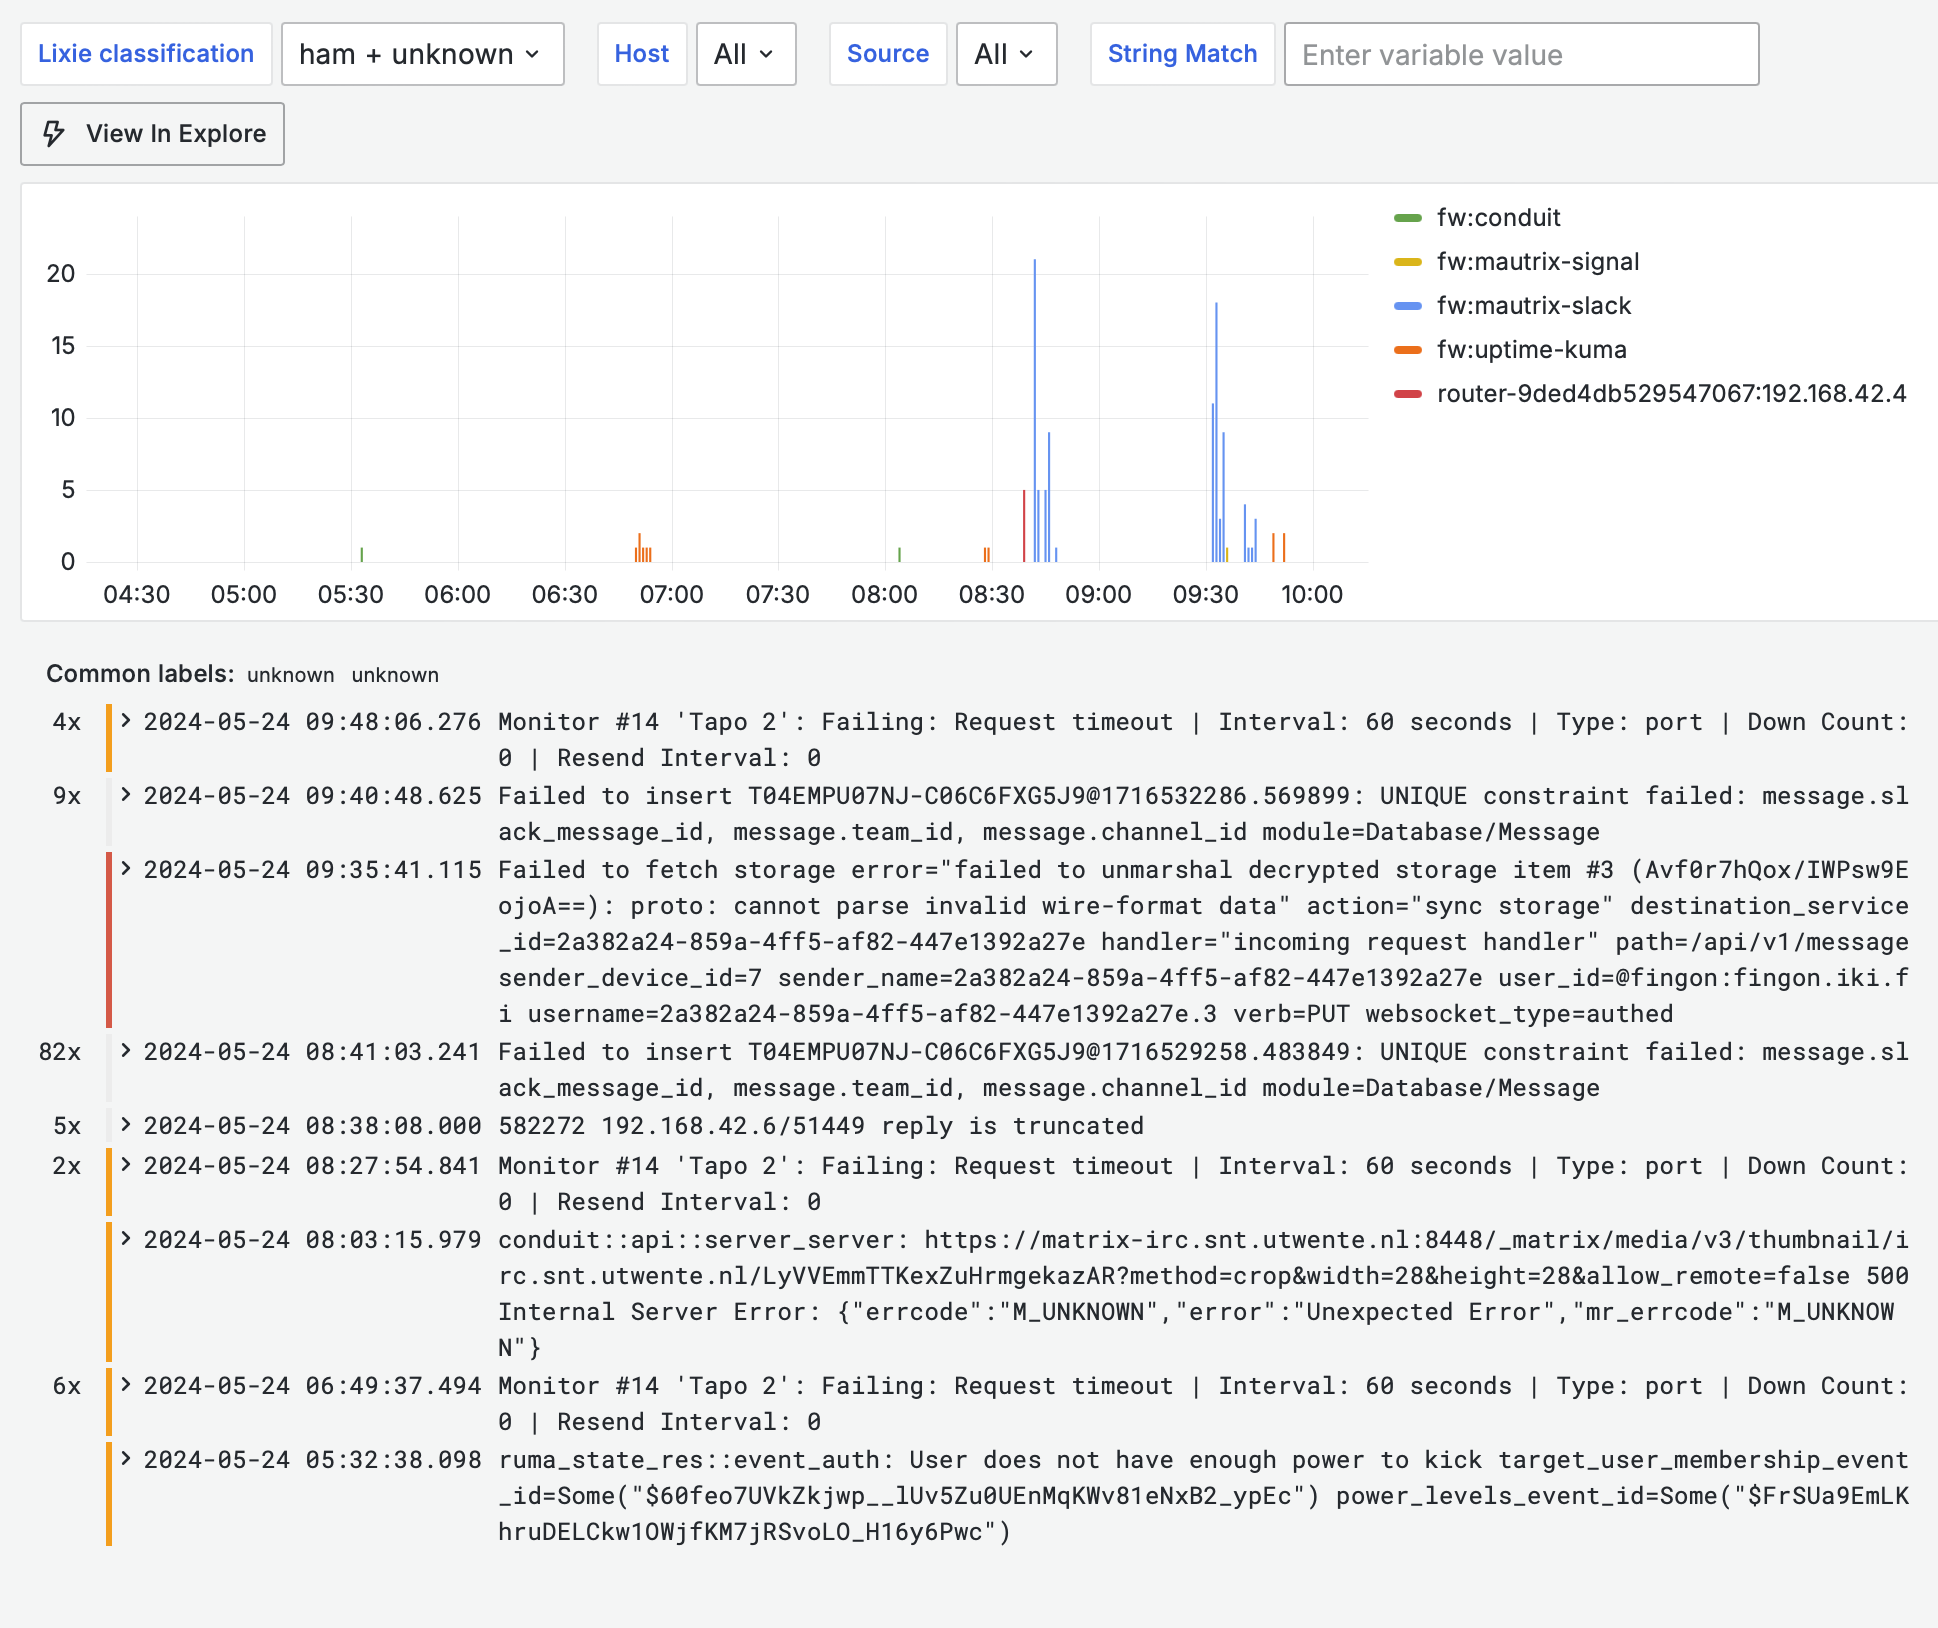 and that’s the way I like it. I add rules every now and then, and mostly look at the filtered view of logs. In the above view (or Lixies own UI), I can see if something new (e.g. new container I added) is spamming something, and if I note it is spam, and I will add Lixie rule for it (in the fancy UI of all things). Subsequently after the Vector configuration has been updated, the Vector pipeline will classify it as spam and my default filtering in Grafana will hide it in the future.
Anyway, that is enough for the day, next planned topic I plan to write about is backup strategy (both for this infra, and in general). We shall see when that happens, and it is entirely possible I get sidetracked to writing about something else before that.